About Me
I am Jorge Mayo, a Water Resources Engineer interested in water management, hydrological modeling, remote sensing, geospatial/visualization applications, machine learning, and utilizing environmental data to drive decision-making processes.
Research
My master's research was focused on quantifying the surface soil moisture and the partitioning of evapotranspiration in dryland ecosystems through distributed hydrological simulations, remote sensing, and field measurements within the Jornada Experimental Range (JER) of the U.S. Department of Agriculture in southern New Mexico, U.S.
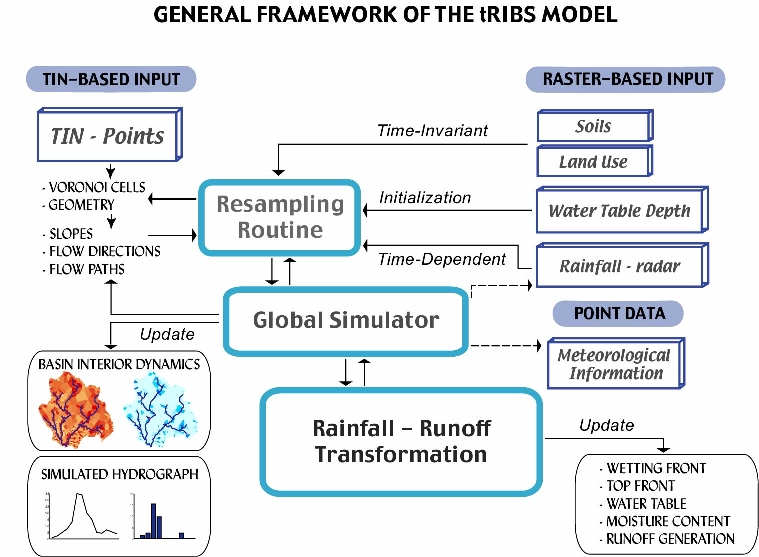
The model ingests terrain, soils, atmospheric forcing, vegetation cover, and activity. A small-size watershed (69 km2) was delineated and selected as the study zone encompassing two eddy covariance stations with soil moisture probes, a sap flow network, and a uniformly distributed summer sampling network (5x5) of soil water content profiles, using a 30 m resolution DEM to derive the Triangular Irregular Network that the model uses to run. tRIBS (TIN-based Real-time Integrated Basin Simulator) is used to simulate three variables (1) evaporation, (2) transpiration, and (3) surface soil water content at the watershed scale during the North American Monsoon (NAM) season of 2019.The Master's Thesis document is available in ProQuest.
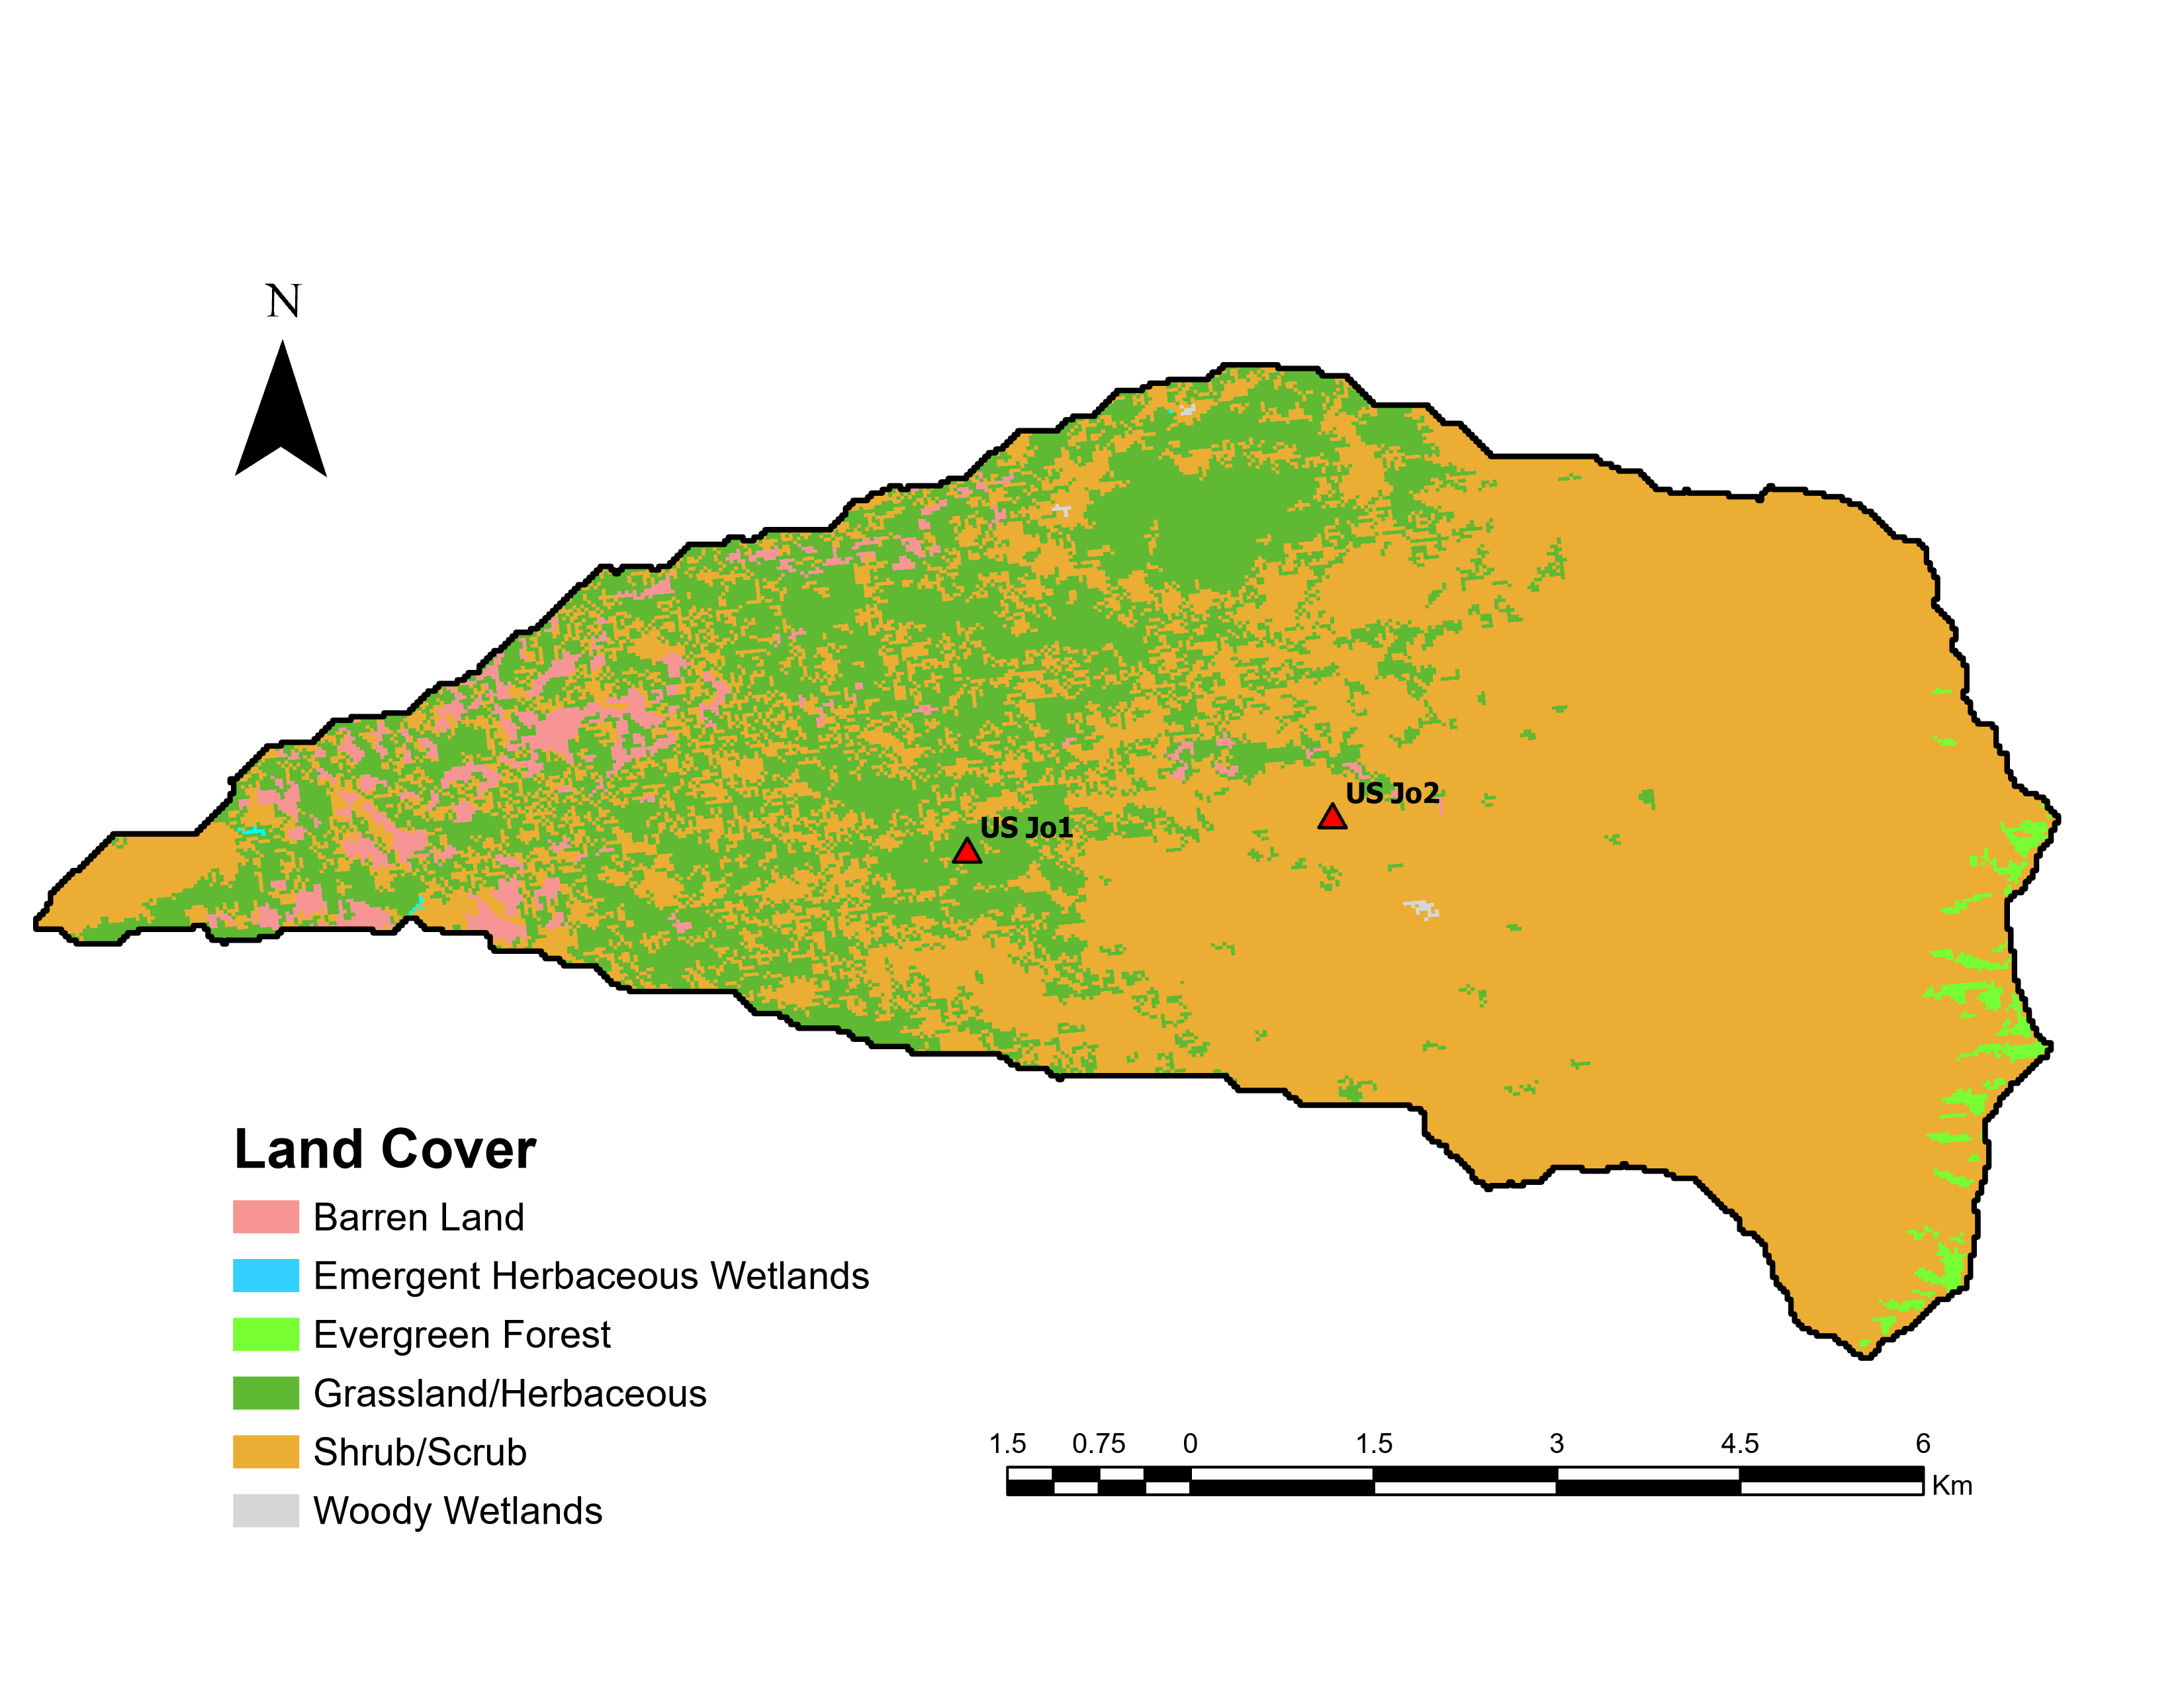
NLCD 2019 - Land Cover Map
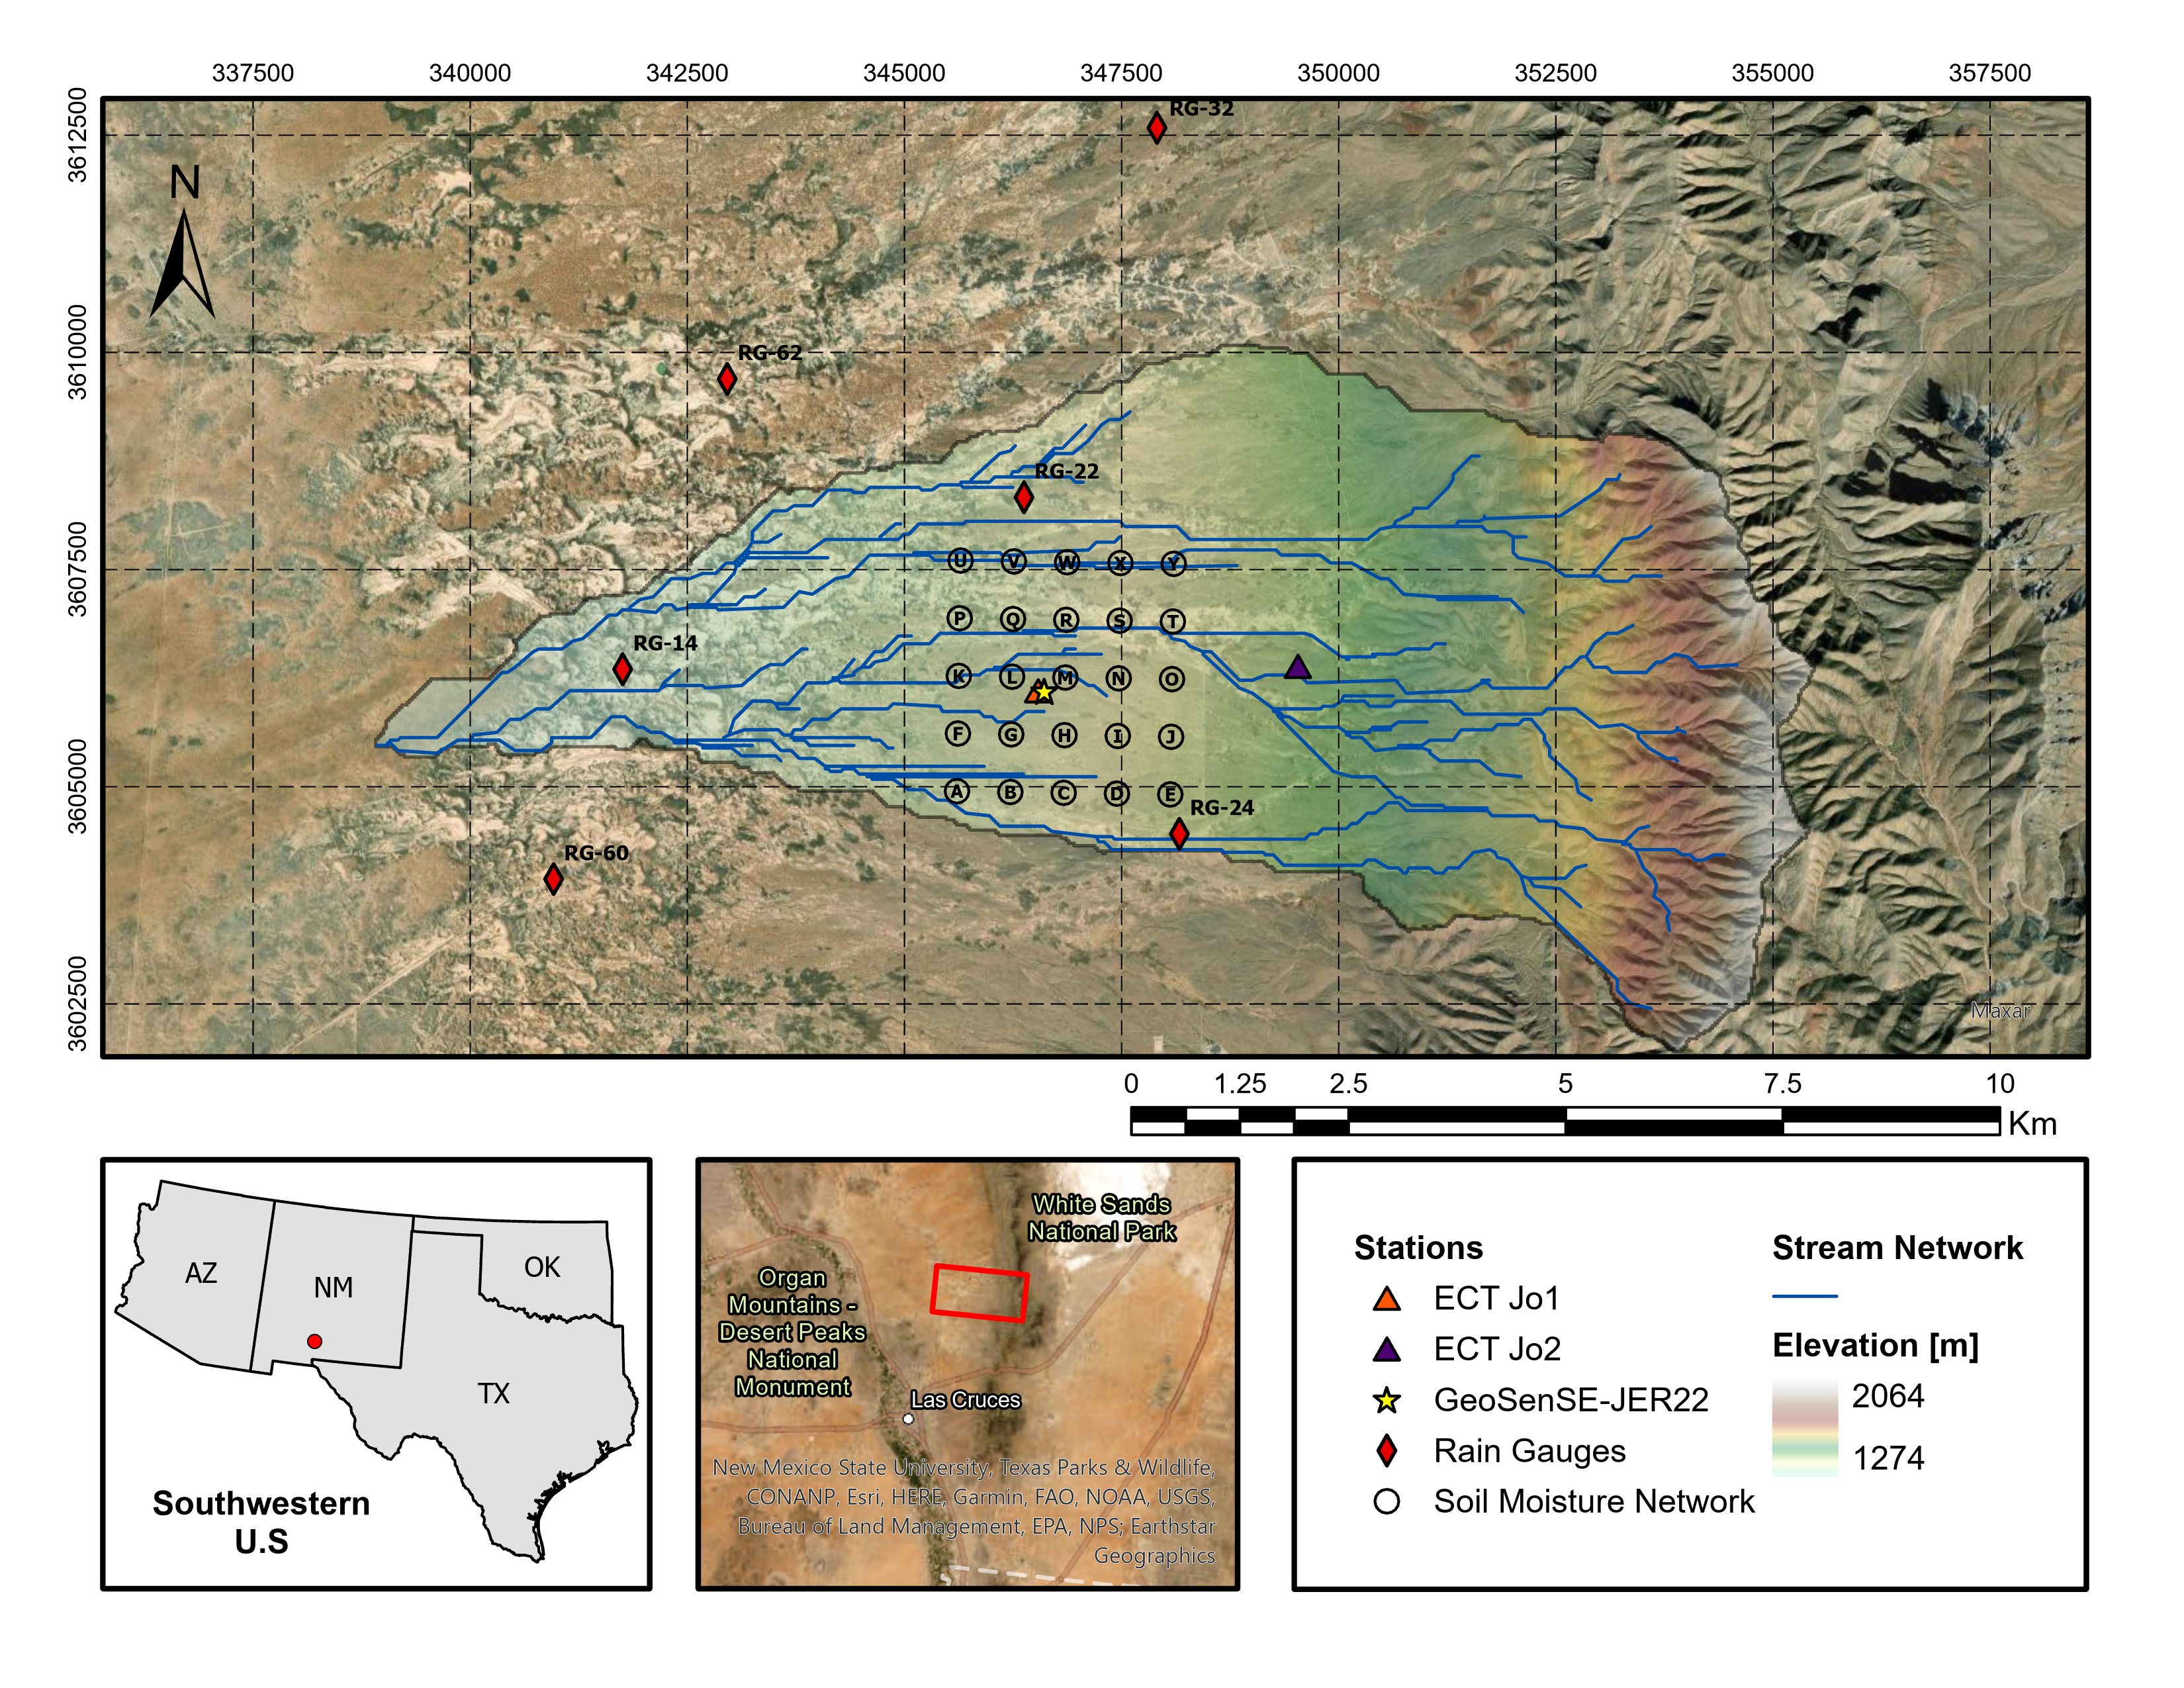
Study Area - JER
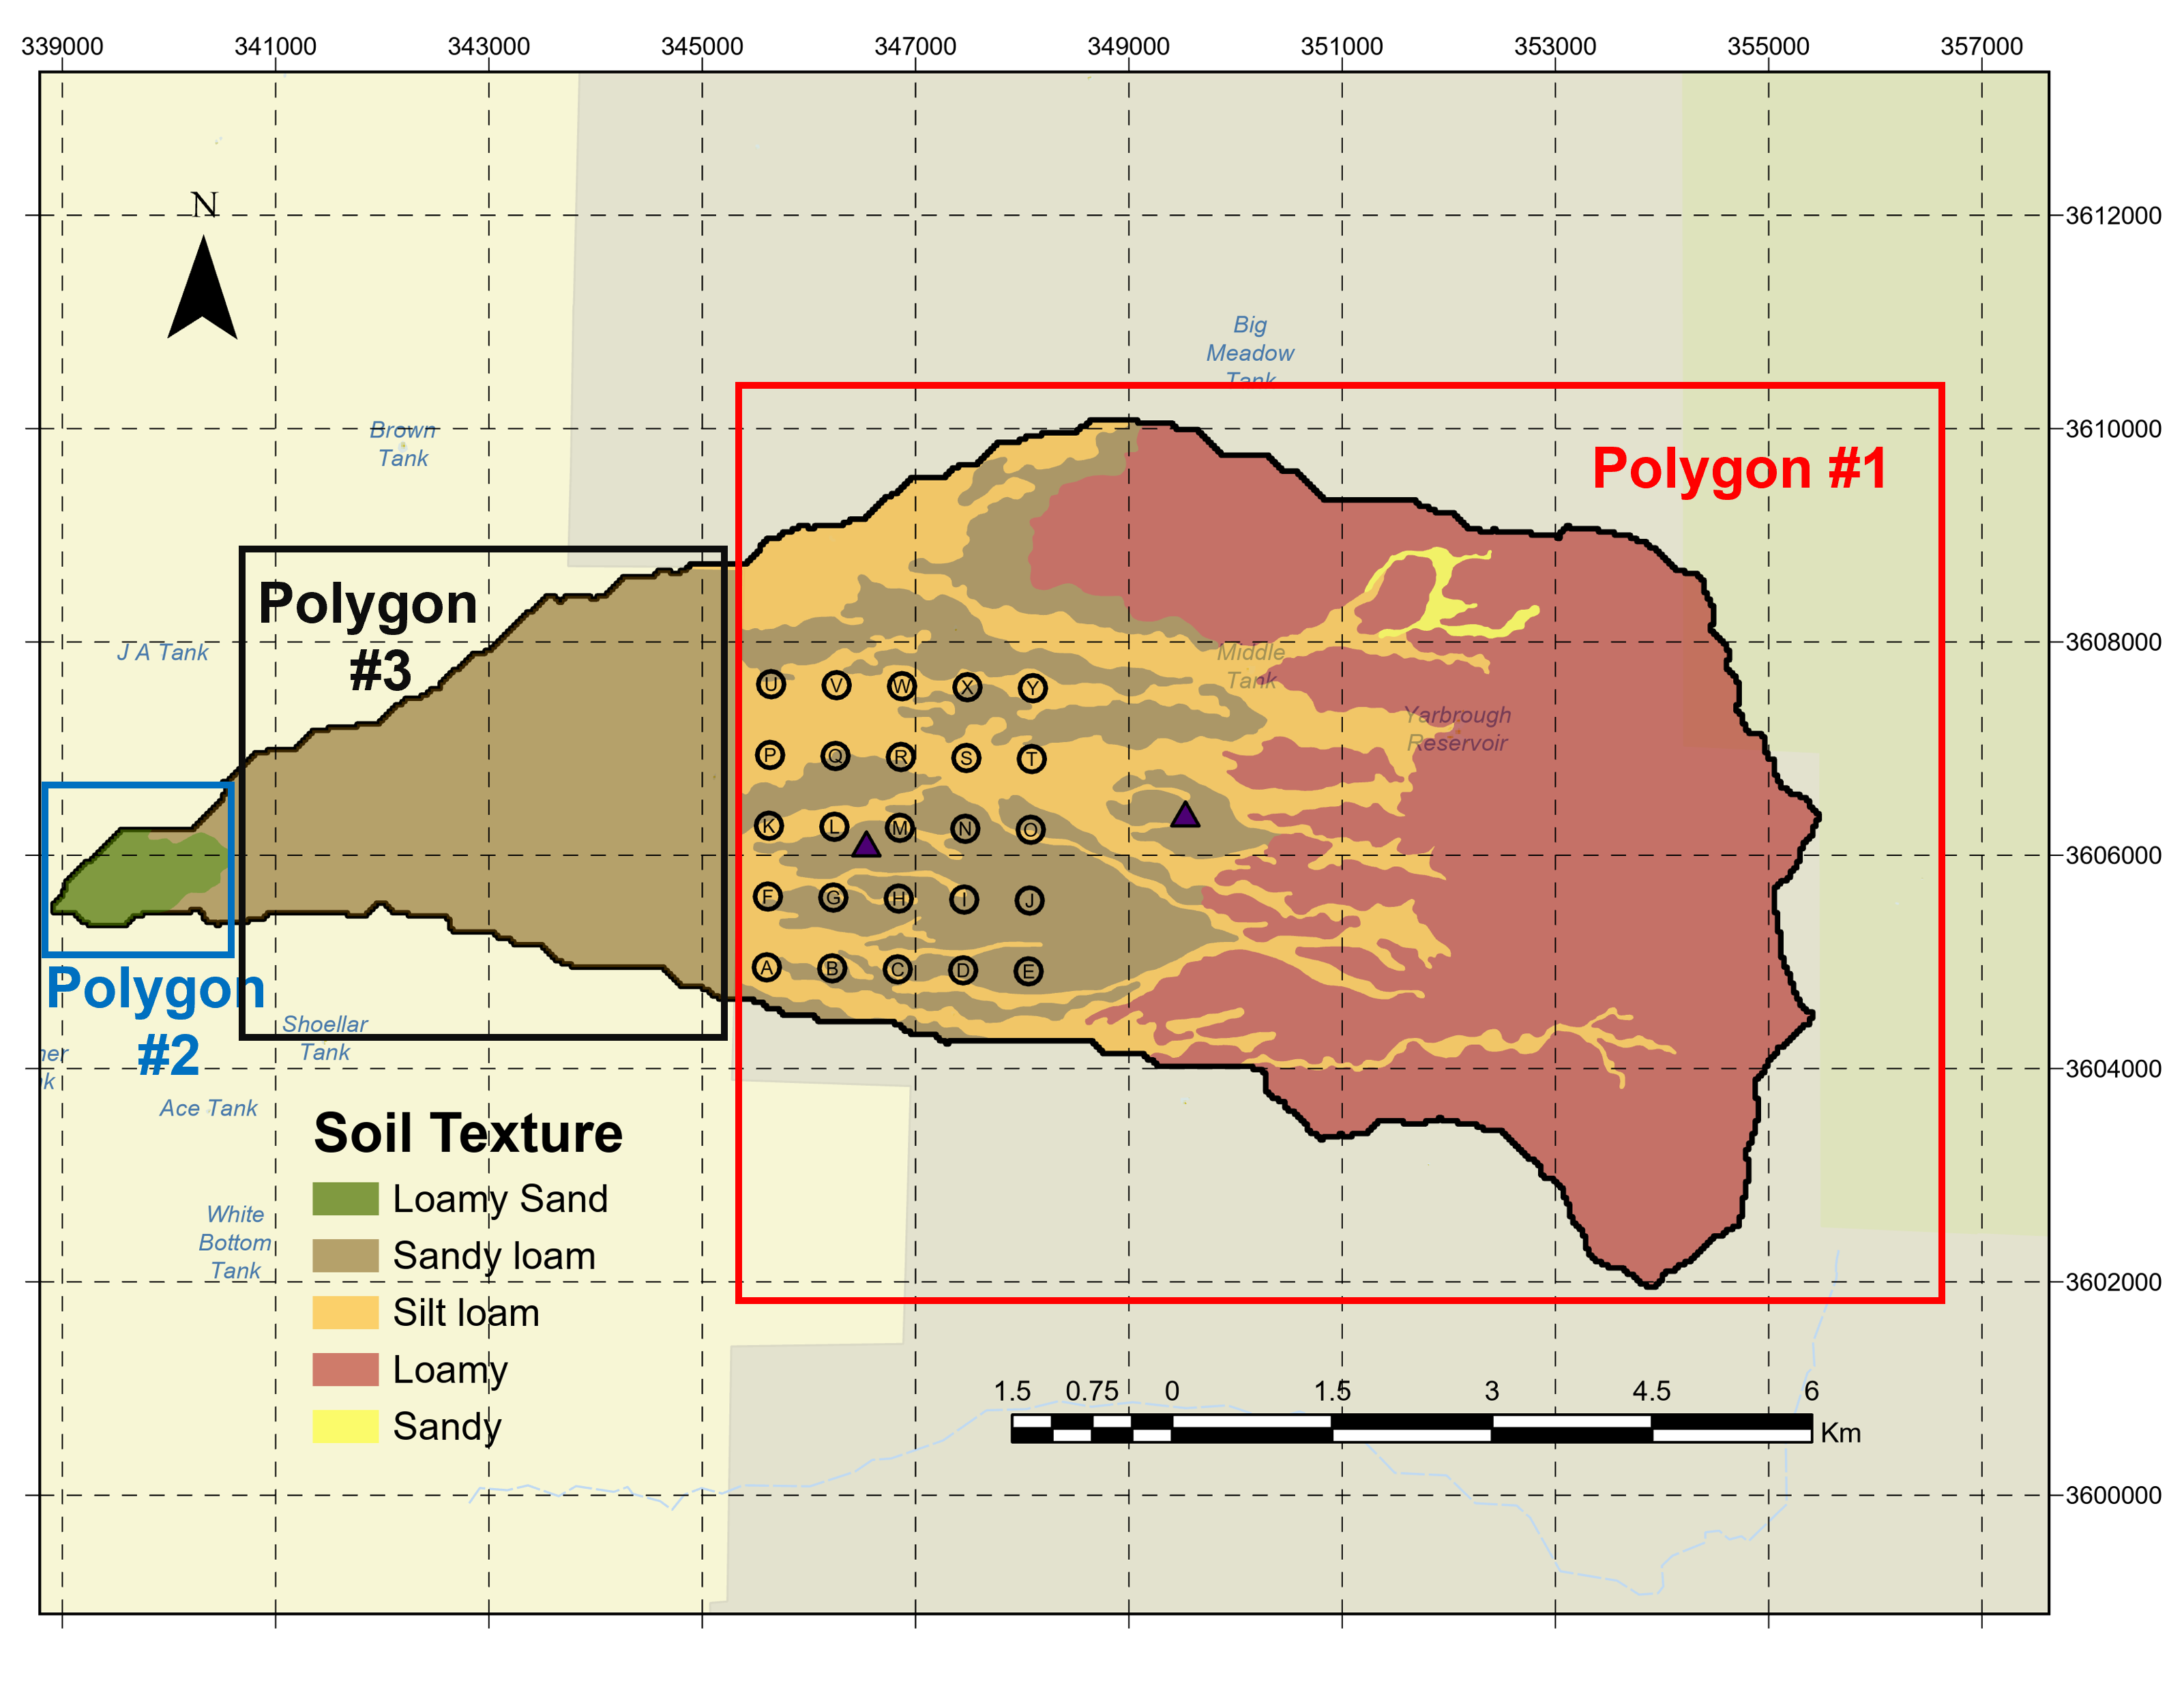
SSURGO Soil Map
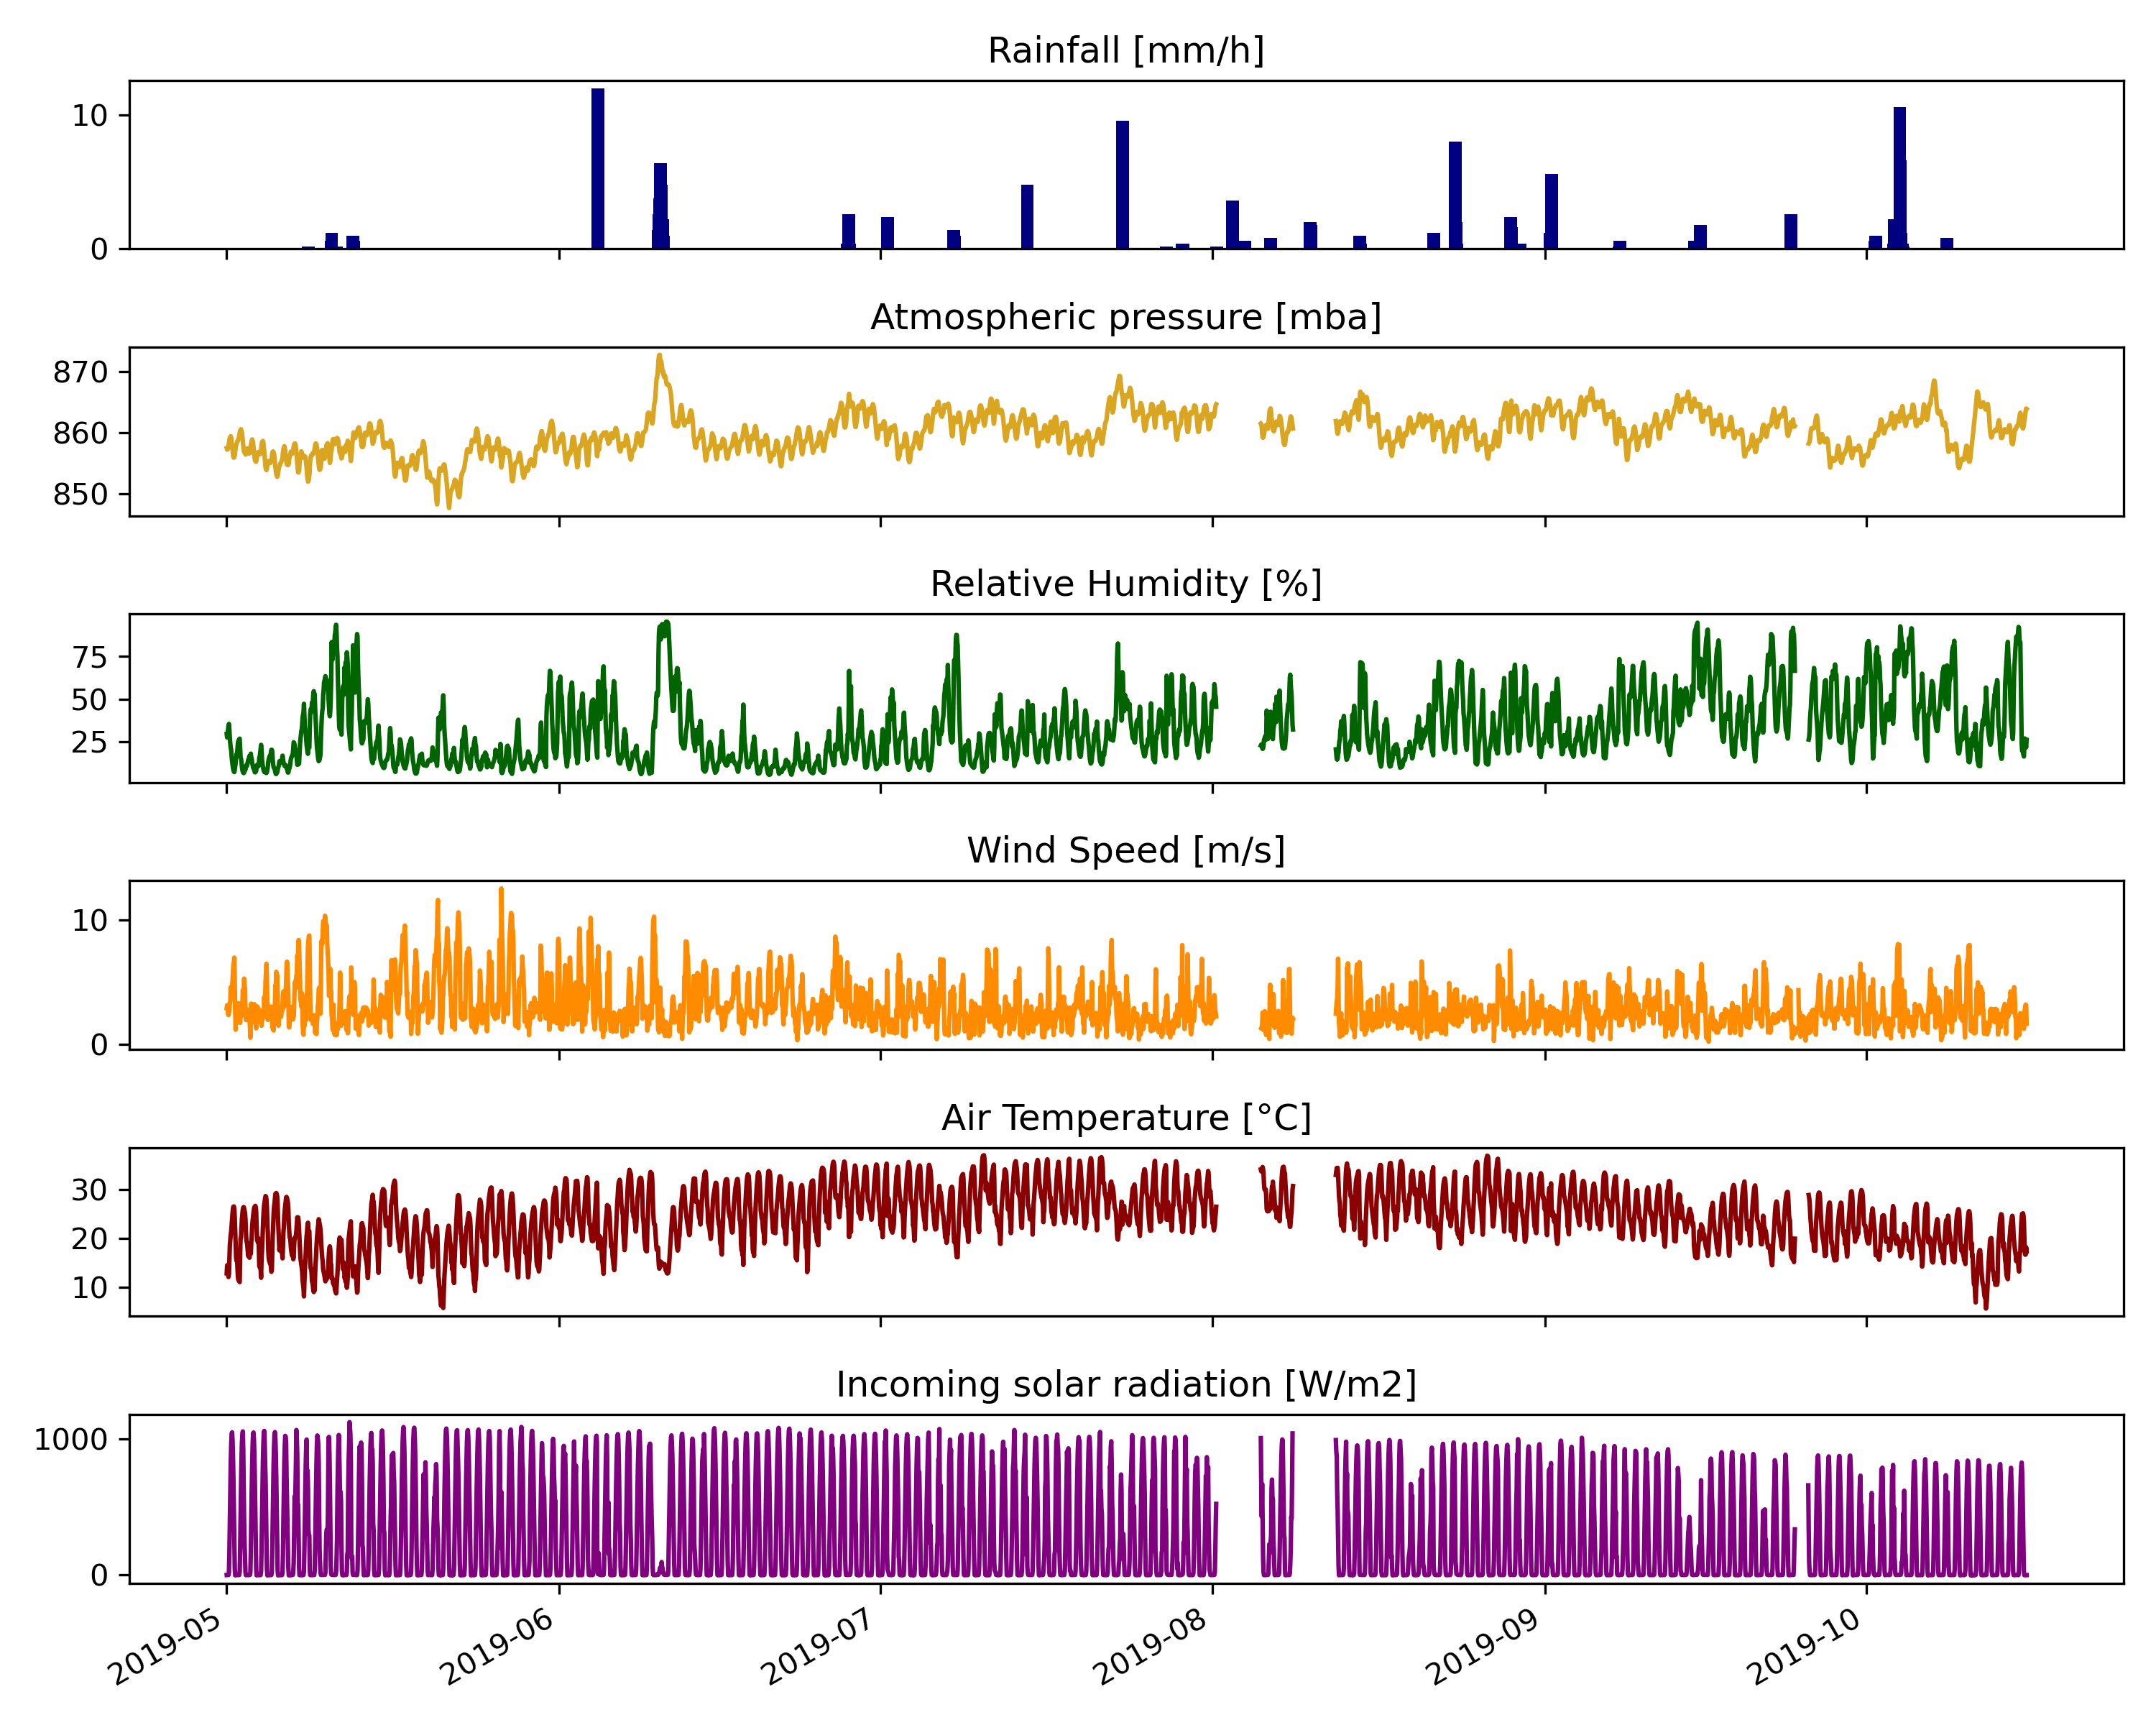
Hydrometeorological Inputs for US-Jo1
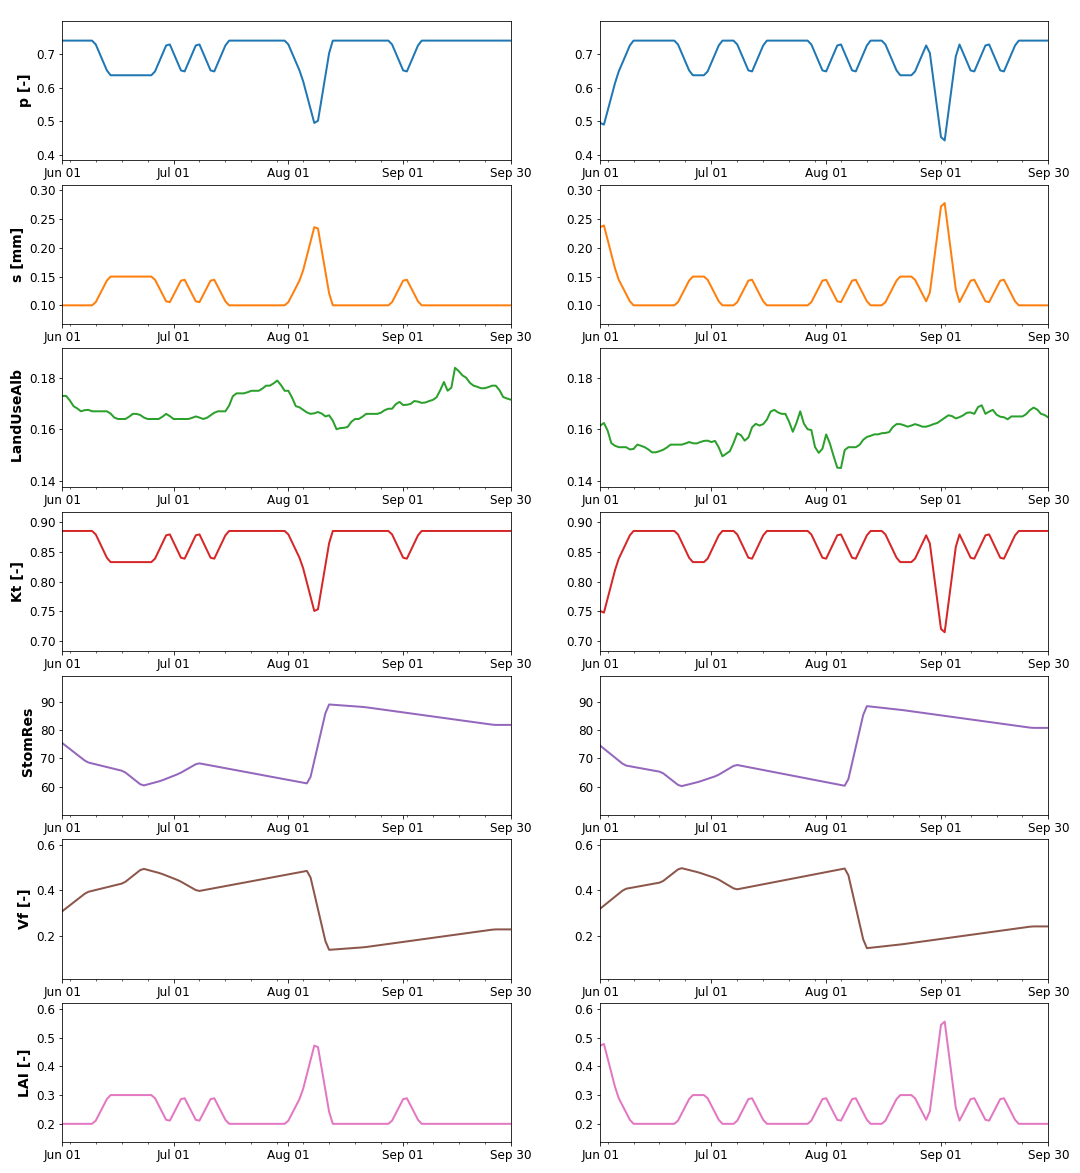
Remotely sensed derived time series of the dynamic vegetation parameters for US-Jo 1(left column) and US-Jo2 (right column)
X
![]()
Results
Hourly time series illustrate that tRIBS shows an overestimating response to rainfall pulses as measured by soil moisture at US-Jo1 and underestimating the recision periods at US-Jo2, but a
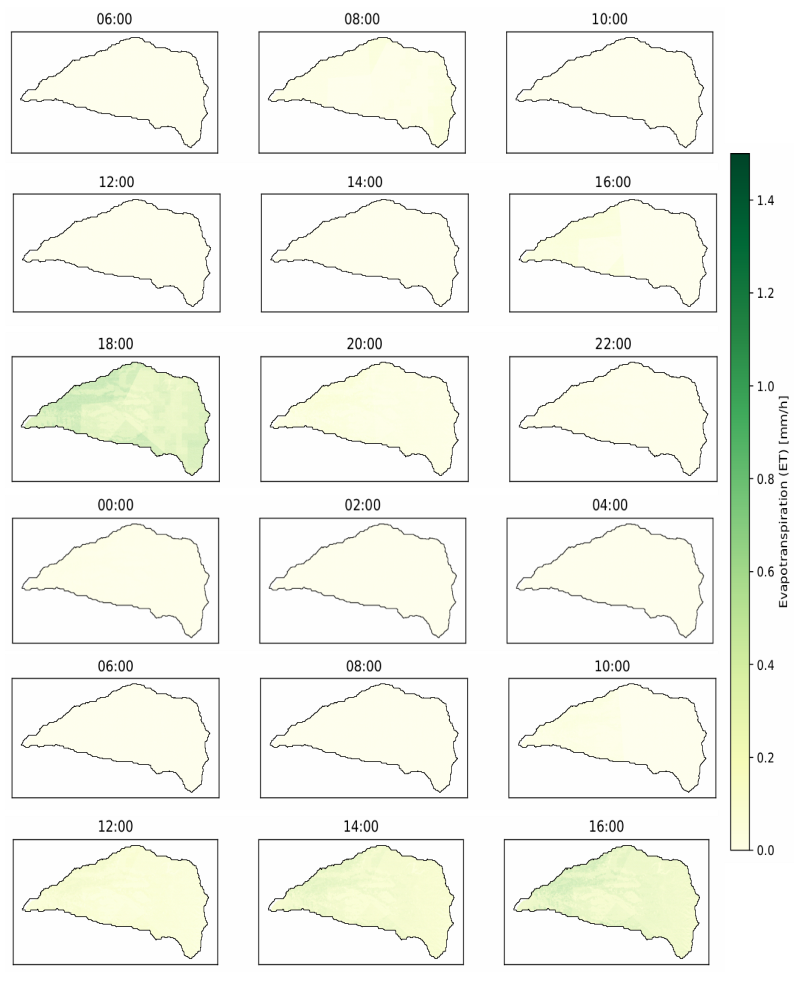
generalized underestimation of ET (except when rain arrives) while capturing well the diurnal cycles during the whole period at both sites. In general, at an hourly scale, tRIBS outputs
represent the temporal variability of both variables at the measurement sites. However, despite the NSE score showing unsatisfactory results for soil moisture and ET at both sites (NSE < 0.4),
the KGE score is equal to or greater than 0.5 for soil moisture, and for ET in US-Jo1, meaning that the model has some level of skill in capturing certain aspects of the observed variability,
but there are still significant discrepancies between the simulated and observed values.
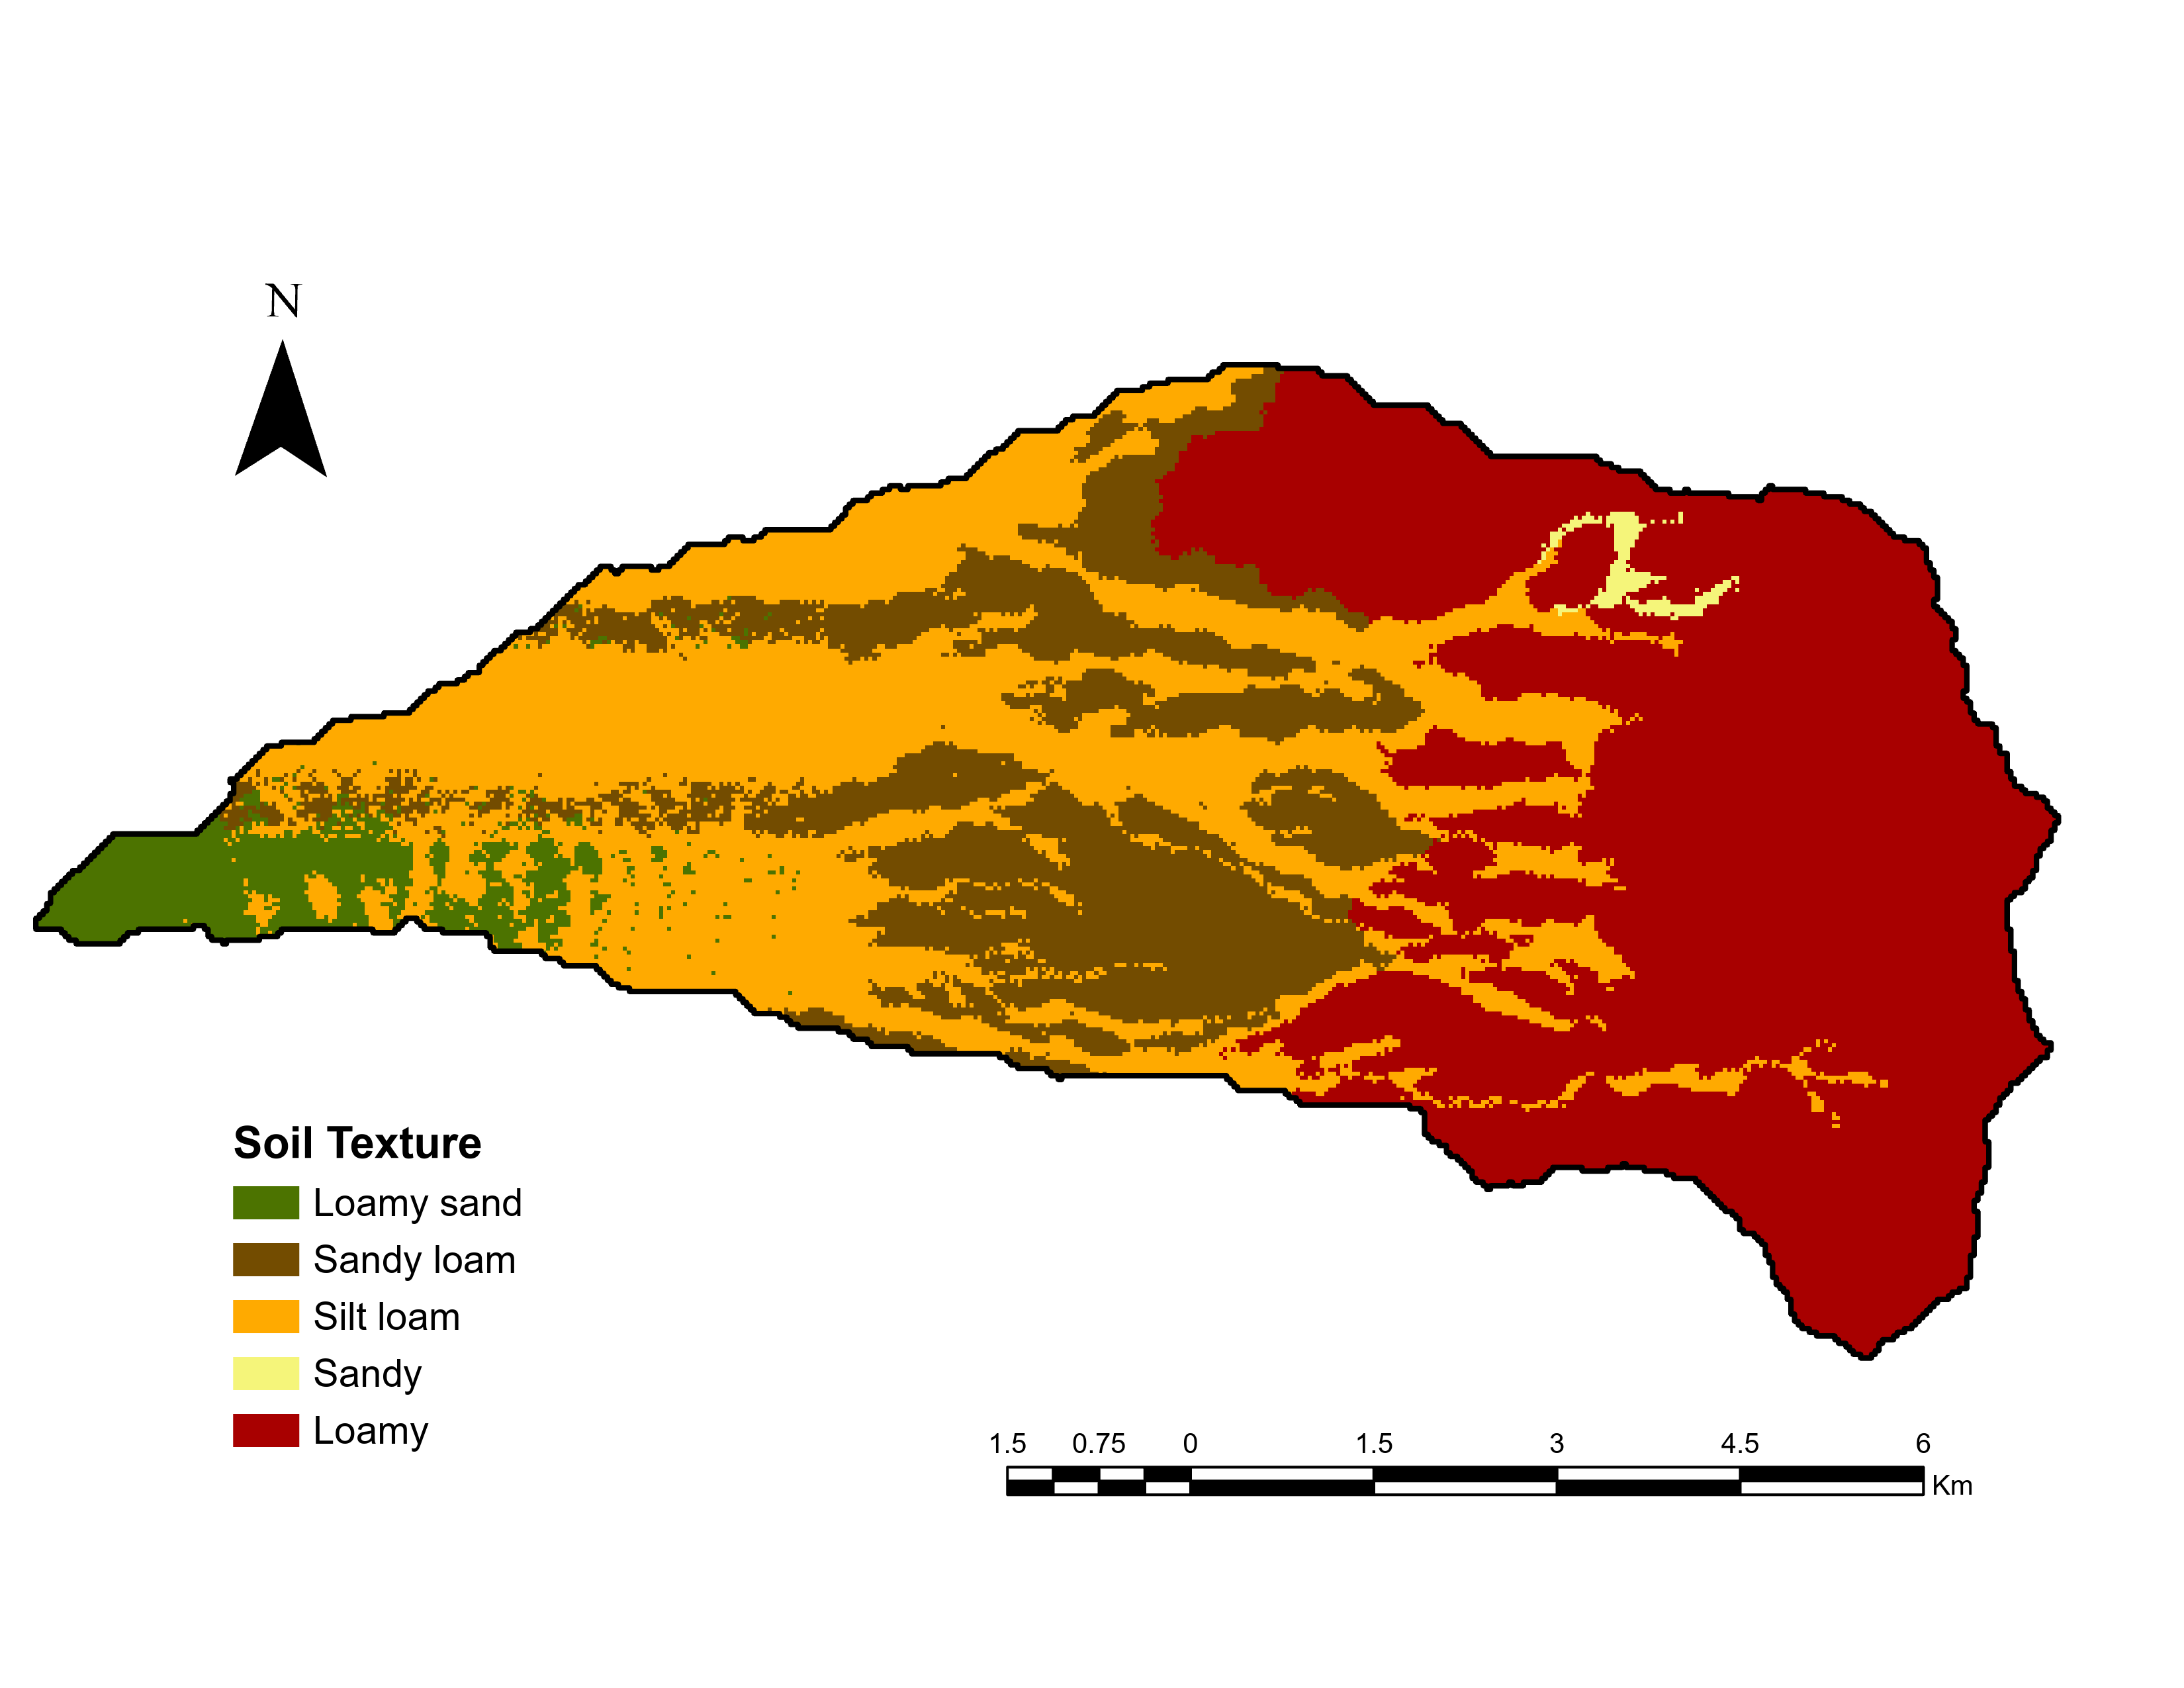
Enhanced ML SSURGO Soil Map
Hourly simulations and observations time series of soil moisture at US-Jo1
Hourly simulations and observations time series of evapotranspiration at US-Jo1
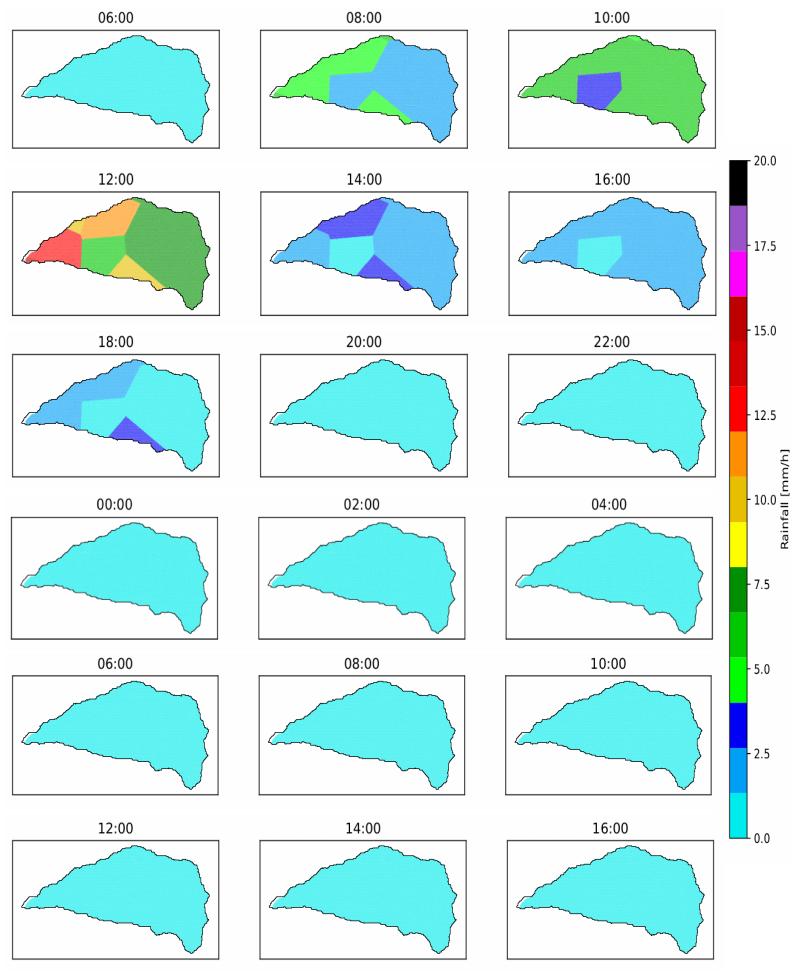
Rainfall event across the watershed. The response shows from June 10th at 06:00 to June 11th at 16:00 LST
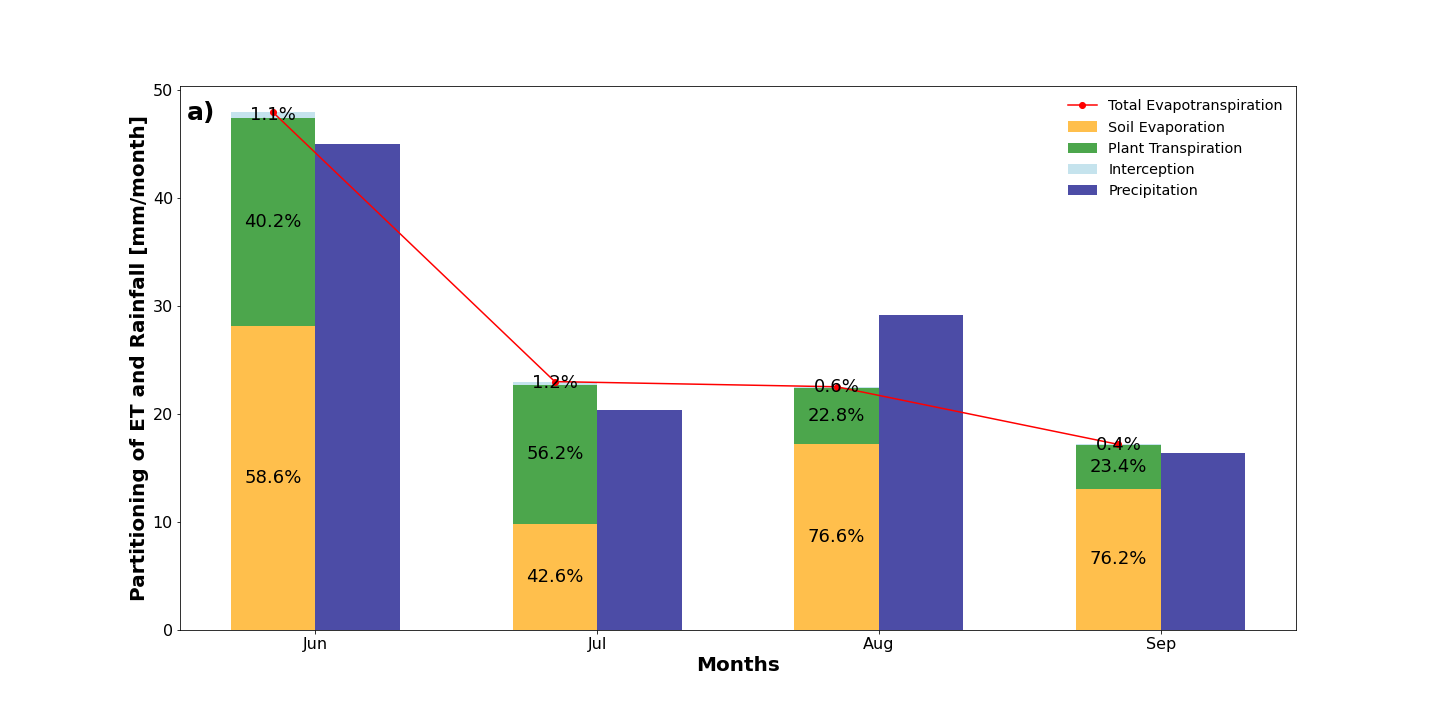
Partitioning components of ET at monthly time scale at US-Jo1
Hourly simulations and observations time series of soil moisture at US-Jo2
Hourly simulations and observations time series of evapotranspiration at US-Jo2
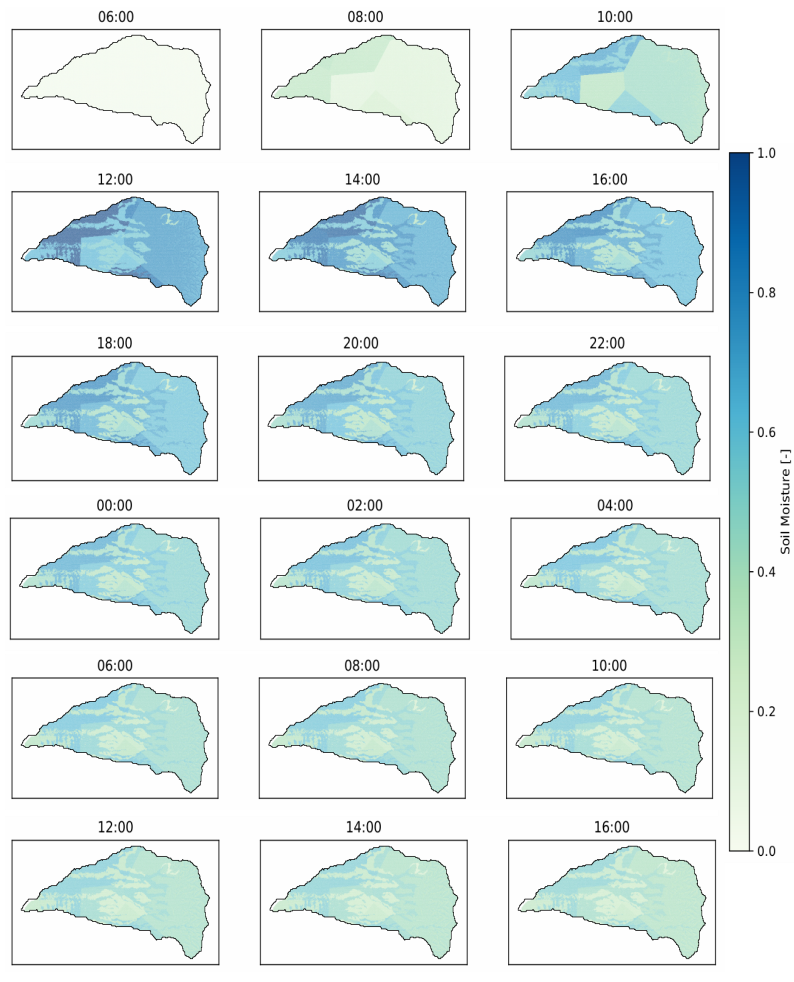
Soil Moisture (Degree of saturation) across the watershed.The response shows from June 10th at 06:00 to June 11th at 16:00 LST
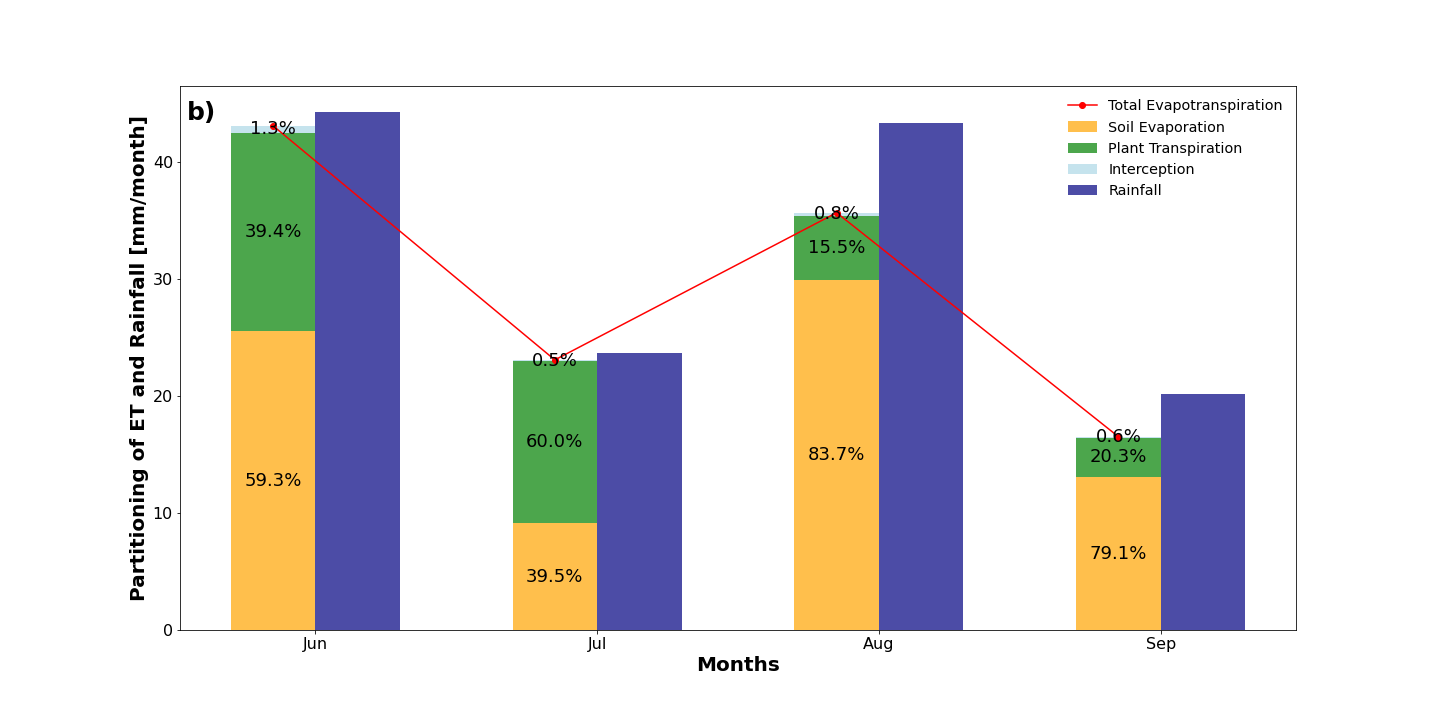
Partitioning components of ET at monthly time scale at US-Jo2.
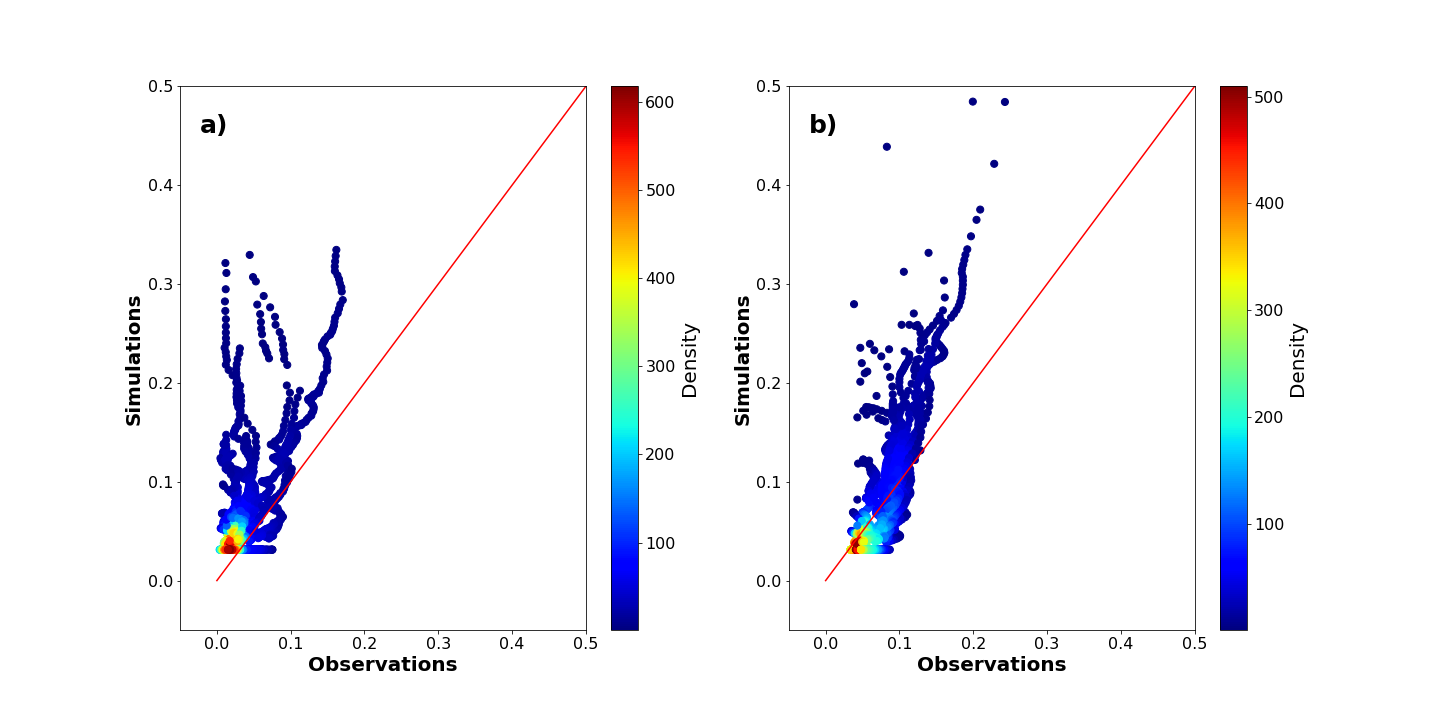
Scatter plots of hourly simulations and observations of soil moisture at a) US-Jo1 and b) US-Jo2
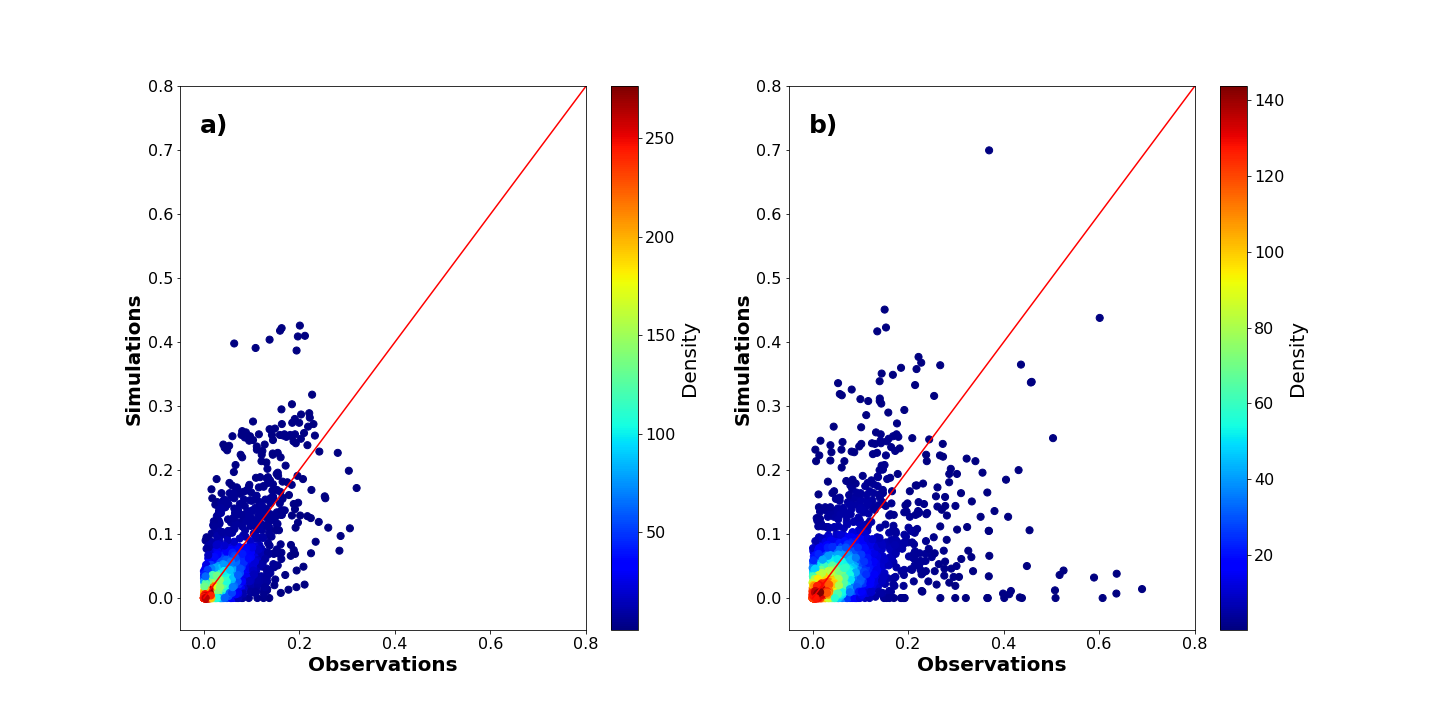
Scatter plots of hourly simulations and observations of evapotranspiration at a) US-Jo1 and b) US-Jo2